




CHATTANOOGA, Tenn. — In an industry long plagued by opaque pricing, unpredictable surcharges, and hidden routing inefficiencies, freight market intelligence has taken a massive leap forward. FreightWaves’ Sonar has officially launched three new truckload dataset groups designed to inject hard numbers and absolute transparency into routing guide failures and escalating contract rates.
For logistics directors, procurement managers, and supply chain executives, the introduction of these tools transforms abstract market estimates into actionable insights. Shippers can now track the real premiums paid for rejected loads, monitor tightening capacity in real-time, and accurately budget for backup coverage.
According to industry experts, these metrics arrive at a critical juncture for the U.S. freight economy, offering a much-needed magnifying glass over shipper-to-provider costs, completely decoupled from carrier operating costs or broker margins.
Main Facts: Decoding the Three New Sonar Indices
The newly introduced dataset groups—updating daily on a seven-day rolling average—focus on specific vulnerabilities in modern transportation networks. They provide precise benchmarks for metrics that were previously calculated using guesswork or delayed historical reports.
The three core indices now live in Sonar’s enterprise user interface include:
- Routing Guide Premiums (RGP2.USA and RGP3.USA): Measures the median percentage change in all-in costs when a load is accepted on the second or third-plus tender, rather than the primary carrier.
- Routing Guide Acceptance Share (RGAS1, 2, and 3 USA): Tracks the exact share of accepted loads at each tender position, ranging from first-choice primary carriers down to fifth-and-beyond backup providers.
- Contract Rate Change Direction (CRCD.USA): Evaluates the average percentage change between new and previous contract base rates, filtering out short-term market noise by isolating rates stable for at least 90 days.
Together, these indices give supply chain professionals a holistic view of structural market shifts, allowing organizations to differentiate between internal routing guide failures and broader macroeconomic capacity crunches.
Chronology and Market Evolution: From Deflation to Rebounding Rates
To fully appreciate the gravity of Sonar’s new datasets, analysts point to the dramatic volatility the truckload market has experienced over the past several years.
The Deflationary Bottom (2023)
During the spring of 2023, the freight market was mired in a prolonged deflationary cycle. Contract rates were actively declining, bottoming out near negative 9% as carriers aggressively competed for shrinking volumes. Shippers enjoyed immense leverage, and primary routing guide compliance was remarkably high.
The Turning Point (2024–2025)
The tide began to turn in mid-2024, when contract resets finally flipped back into positive territory. Throughout late 2024, contract rate changes hovered between 3% and 6%. By November of last year, second-tender premiums were modest—hovering near 4%—as capacity was only just beginning to tighten. First-tender acceptance rates comfortably sat at a robust 93%.
The Acceleration and Current Tightening (2026)
The landscape transformed dramatically moving through 2026. Capacity constraints tightened rapidly, pushing the Contract Rate Change Direction index to a staggering peak above 16% in early October, before leveling off slightly to its current reading of 13.11%. This current baseline represents the highest contract repricing environment seen since early 2022, towering far above the five-year historical average of 3.47%.
Supporting Data: Breaking Down the Numbers
The hard figures provided by Sonar’s daily updates paint a vivid picture of a market where primary carrier compliance is eroding, and fallback options are growing increasingly expensive.
- Primary Compliance is Slipping: First-tender acceptance currently stands at 89.29%. While this may seem healthy at a glance, it sits below the 12-month average of 89.54% and represents a noticeable drop from the 93% acceptance rates recorded late last year.
- The Cascading Effect: When primary tenders fail, freight cascades down the routing guide. The second position now accounts for 6.67% of accepted loads, while the third-plus position captures 4.16%.
- The Staggering Cost of Rejections: The financial penalty for routing guide failures is steep. The second tender is currently running at a 9.25% premium (compared to a 12-month average of 8.77%). Meanwhile, the third-plus tender sits at a punishing 19.84% premium—effectively doubling the cost penalty of a second-tender failure.
- Seasonal Spikes: Historical and seasonal data underline just how volatile these premiums can become. During periods of acute seasonal pressure—such as late December, early February, and the summer stretch from June into early July—third-tender premiums have historically breached the 35% mark.
- Contract Resets: The CRCD.USA index reading of 13.11% signifies that new contracts are resetting roughly 13% higher than the rates they replace. This is more than triple the long-term average, signaling that shippers are locking in higher baseline costs for the foreseeable future.
Official Responses and Expert Insights
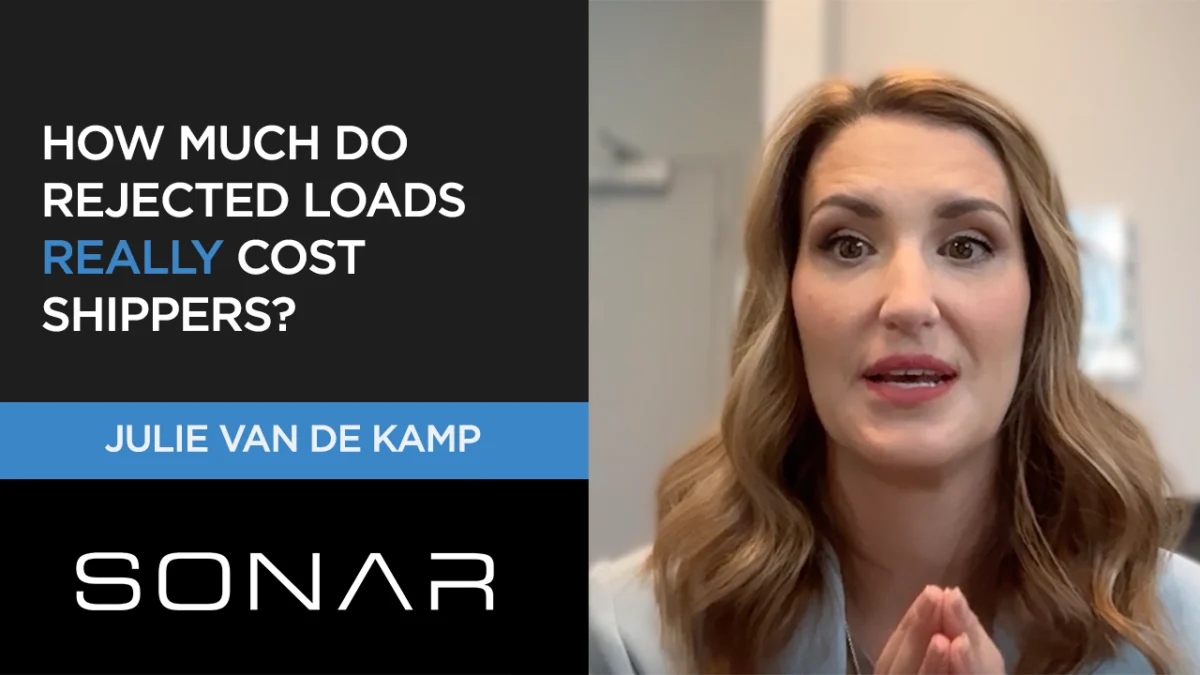
Industry leaders have been quick to dissect the implications of these datasets. Julie Van de Kamp, a prominent voice in freight market analytics, emphasized the diagnostic power of the new metrics during a recent Sonar breakdown.
Addressing the nuances of Routing Guide Acceptance Share, Van de Kamp issued a direct challenge to logistics operators:
"If your first tender acceptance is slipping faster than the national number, then there’s a problem in your routing guide, not just with the market."
This distinction is vital for corporate accountability. By comparing internal network performance against national benchmarks, logistics teams can determine whether internal operational errors, unrealistic primary rate expectations, or true macroeconomic capacity shortages are driving up their transportation spend.
Van de Kamp also highlighted the Contract Rate Change Direction index as the most significant of the three releases. By eliminating short-term volatility and focusing exclusively on rates stable for 90 days or more, CRCD.USA strips away emotional panic buying and gives procurement teams a pristine view of true multi-month pricing trends.
Summarizing the current environment, Van de Kamp noted that while routing guides are technically holding near historical averages, the volume of freight cascading to secondary and tertiary providers is noticeably higher than it was a year ago. When that cascade happens, shippers are systematically paying 10% more at the second tender and roughly 20% more further down the line, all while signing new contracts at the most aggressive repricing rate since 2022.
Implications for Shippers, Brokers, and Carriers
The launch of these indices carries profound strategic implications across the entire supply chain ecosystem:
1. For Shippers and Procurement Teams
Shippers can no longer afford to treat routing guide management as a set-it-and-forget-it administrative task. With real-time visibility into second and third-tender premiums, logistics managers can build data-driven contingency budgets. If historical and current data show a predictable 10% to 20% penalty for cascading loads, transportation budgets can be fortified accordingly. Furthermore, identifying internal routing guide decay prevents companies from needlessly blaming the broader market for self-inflicted carrier churn.
2. For Carriers and Fleet Operators
Carriers gain a clearer understanding of the leverage they hold during contract renewal cycles. With contract rates resetting 13% higher year-over-year, fleets have empirical backing to negotiate sustainable rate increases that reflect true operating environments, driver wage pressures, and equipment costs.
3. For Third-Party Logistics (3PLs) and Brokers
As more freight slips past primary routing guides into secondary and backup tiers, brokers face immense pressure to secure reliable capacity without eroding their own margins. Transparent premium data allows brokers to price spot and backup coverage more intelligently, ensuring they remain competitive while protecting profitability.
Looking Ahead: The Future of Freight Transparency
As the transportation sector continues to navigate post-pandemic volatility, economic shifts, and seasonal capacity crunches, tools like Sonar’s new dataset groups are shifting the paradigm from reactive firefighting to proactive strategy.
By turning qualitative market sentiment into quantifiable, daily-updated metrics, freight professionals are better equipped than ever to optimize their networks, protect their bottom lines, and secure capacity in an increasingly competitive marketplace.