





WASHINGTON — The U.S. Department of Transportation’s (USDOT) recent overhaul of the Corporate Average Fuel Economy (CAFE) standards provides a modest tailwind for domestic automotive production, but logistics analysts agree it is wholly insufficient to transform the broader truckload freight market over the next 12 months.
According to advanced market intelligence from FreightWaves SONAR, the defining characteristic of the 2026 freight landscape is not surging consumer demand or an influx of new manufacturing volume. Instead, the market is tightening almost exclusively due to capacity exiting the industry.
While federal regulators project that the newly finalized policy will lower vehicle costs and inject flexibility into Detroit’s assembly plants, data suggests the macroeconomic realities facing consumers—alongside existing structural protections—will mute the anticipated ripples through the national supply chain.
Main Facts: The "Freedom Means Affordable Cars" Rule
On Sept. 28, the USDOT finalized its “Freedom Means Affordable Cars” rule, officially resetting the National Highway Traffic Safety Administration’s (NHTSA) CAFE standards through model year 2031.
- The Target Shift: The rule lowers the required fleet-wide fuel economy average to a modest 34.5 mpg by model year 2031, a sharp departure from prior trajectories that approached 50.4 mpg. Crucially, the reset removes assumptions regarding aggressive Electric Vehicle (EV) production mandates and credit-trading systems.
- Projected Savings: The administration estimates the policy will cut average new-vehicle prices by $1,300 and save American consumers a cumulative $138 billion over five years.
- The Enforcement Landscape: Following the passage of the One Big Beautiful Bill Act in July 2025, the civil penalty for failing to meet CAFE targets was set to $0. Consequently, the new targets function more as regulatory guidance rather than punitive constraints.
- The Freight Reality: Despite lower compliance bars, the rule does not alter the underlying macroeconomic pressures dictating car prices today—specifically stubborn interest rates, fluctuating fuel costs, and existing tariff structures.
Chronology: Regulatory Milestones and Market Evolution
To understand how the current freight environment developed alongside federal fuel economy policy, it is necessary to examine the historical interplay between environmental mandates and commercial logistics:
- 1964: The U.S. implements the "Chicken Tax," a 25% tariff on imported light trucks. This protectionist measure sets the stage for decades of domestic pickup and SUV dominance.
- 2007: Congress passes major energy legislation targeting a combined fleet average of 35 mpg by model year 2020 (49 U.S.C. 32902) alongside aggressive Renewable Fuel Standard (RFS) biofuel volume targets.
- July 2025: The legislative shift sets CAFE civil penalties to $0, effectively neutralizing the financial teeth of past fuel economy mandates.
- Sept. 28, 2025–2026: USDOT and NHTSA construct the “Freedom Means Affordable Cars” framework, responding to consumer pushback against mandatory EV build-outs and rising vehicle sticker prices.
- Q3 2026: SONAR data reveals a widening gap between national tender volume indices and tender rejections, signaling severe capacity contraction despite flat-to-negative actual freight movement.
Supporting Data: SONAR Insights and Freight Impact Models
To measure whether regulatory changes in Detroit, Toledo, Indianapolis, and the Southeast auto corridor actually translate into moving loads, analysts look to high-frequency freight data.
Q3 Truckload Market Comparison (SONAR Blended STVI and STRI)
| Metric | Q3 2025 (Average) | Q3 2026 (Average) | YoY Change |
|---|---|---|---|
| USA Tender Volume Index (STVI) | 10,447 | 11,338 | +8.5% |
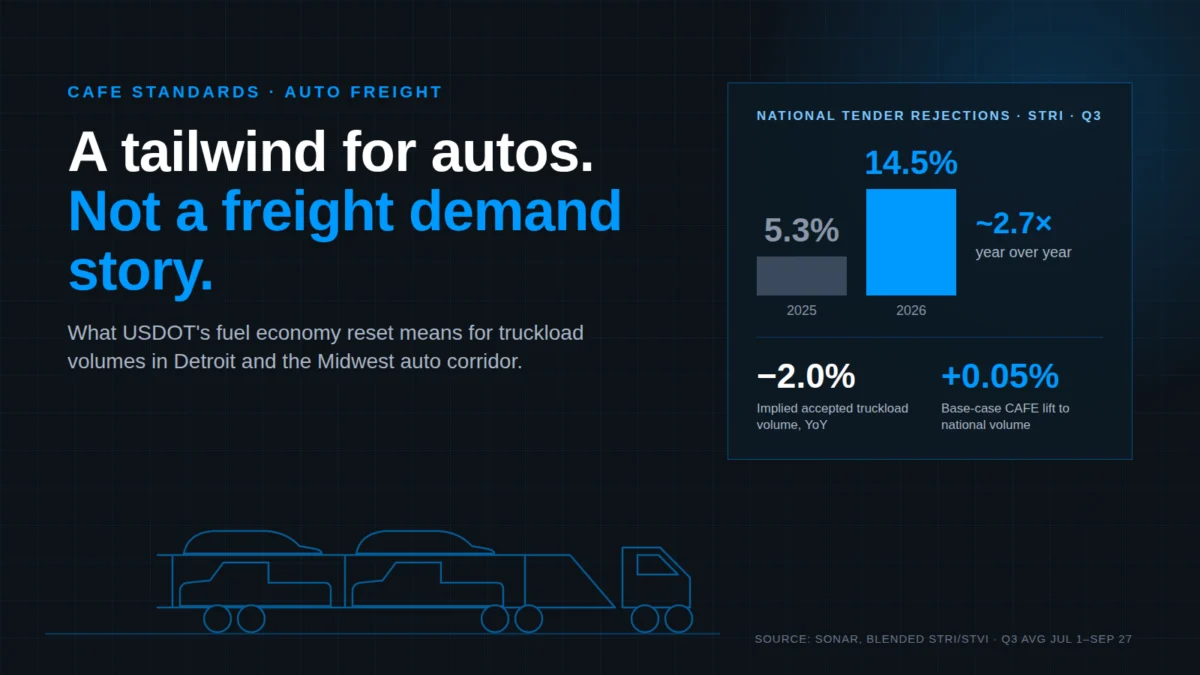
| USA Tender Rejection Index (STRI) | 5.3% | 14.5% | +920 bps |
| Implied Accepted Volume (USA)* | 9,892 | 9,693 | -2.0% |
| Detroit (DTW) Tender Volume | 206.1 | 233.1 | +13.1% |
| Detroit (DTW) Tender Rejections | 5.0% | 17.6% | +1,260 bps |
| Implied Accepted Volume (Detroit)* | 195.8 | 192.0 | -1.9% |
*Note: Implied accepted volume = STVI × (1 − STRI). This is a directional estimate demonstrating how rejected loads get re-tendered, artificially inflating tender volume during market tightening.
Estimated Freight Lift Scenarios from the CAFE Rollback
Even under aggressive forecasting models, the CAFE reset offers a negligible boost to national truckload volume:
- Bear Scenario (20% of projected savings realized): Adds ~84,000 units (+0.5% production lift). Generates a ~0.03% lift to national truckload volume and ~0.1% in core auto markets.
- Base Scenario (40% of savings realized): Adds ~167,000 units (+1.0% production lift). Generates a ~0.05% lift to national volume and ~0.3% in core auto markets.
- Bull Scenario (75% of savings realized): Adds ~314,000 units (+2.0% production lift). Generates a ~0.10% lift to national volume and ~0.5% in core auto markets.
When juxtaposed against national tender rejections leaping from 5.3% to 14.5% year-over-year, a 0.05% to 0.1% volume lift is little more than a rounding error.
Official Responses and Stakeholder Perspectives
Regulatory rollbacks always generate sharp divisions among automakers, labor organizations, and logistics providers.
- The Administration’s View: USDOT leadership defends the reset as a vital consumer protection measure, arguing that artificially inflated vehicle standards priced working-class families out of the new-car market. By easing compliance timelines, the administration asserts that manufacturers can reallocate capital toward affordable, high-demand internal combustion engines.
- The Domestic Automakers: The "Detroit Three" (General Motors, Ford, and Stellantis) stand as the primary structural beneficiaries of looser CAFE rules. Because their product mixes are heavily weighted toward larger trucks and SUVs, removing stringent fuel economy ceilings protects their highest-margin lines. Furthermore, it safeguards existing parts-heavy supply chains concentrated throughout the Midwest.
- The Logistics and Trucking Sector: Motor carriers remain pragmatic. While freight operators welcome any policy that prevents supply chain shocks, logistics executives emphasize that regulatory adjustments cannot manufacture demand in a vacuum. Car haulers, flatbed operators, and dry-van fleets continue to focus on driver availability, equipment replacement costs, and insurance premiums rather than federal mileage targets.
Implications: Mandates vs. Markets and the Reality of Fleet Dynamics
To fully grasp why the CAFE rollback will not trigger an economic boom for truckers, one must look at the historical precedent of other federal mandates—most notably the Renewable Fuel Standard (RFS).
Lessons from the Renewable Fuel Standard
The 2007 energy law paired CAFE targets with aggressive biofuel blend mandates, such as requiring 36 billion gallons of renewable fuel by 2022. The implementation of those targets offers a clear lesson in how legislated numbers collide with physical reality:
- Infrastructure Dictates Delivery: Where a mandate aligned with existing fuel distribution systems (such as corn ethanol), it succeeded. Where it outpaced infrastructure (such as cellulosic biofuels), the targets failed and required continual waivers or reductions.
- Behavioral Adaptation: Obligated parties often alter their behavior to technically satisfy the rule without achieving the original intent. Similarly, automakers historically utilized footprint-based standards to systematically increase vehicle size rather than fundamentally alter fleet efficiency.
The Dominance of Heavy Trucks
Two entrenched regulatory and economic forces continue to shape the American vehicle fleet: footprint-based standards that reward larger vehicle footprints, and the enduring 60-year-old Chicken Tax protecting domestic light trucks from foreign competition.
In model year 2024, light trucks (including SUVs and pickups) accounted for 66% of all new vehicle sales, with SUVs alone capturing 50%, according to Environmental Protection Agency (EPA) data. Average new-vehicle weight reached a record 4,371 pounds in model year 2023, with the average new pickup outweighing the average sedan by roughly 1,535 pounds.
For freight, heavier vehicles translate directly into denser, heavier loads for suppliers and component haulers. However, with federal weight limits capped at 80,000 pounds for car haulers—and ongoing industry debates regarding the impact of heavier vehicle weights on road infrastructure—this dynamic protects existing baseline manufacturing volume rather than creating explosive new freight opportunities.
Frequently Asked Questions (FAQ)
What do the new 2026 CAFE standards change?
The USDOT finalized a reset that lowers the fleet fuel economy path to a 34.5 mpg average by model year 2031 (down from previous trajectories exceeding 50 mpg) and removes structural reliance on EV production quotas and credit trading.
Will the CAFE rollback increase truckload freight volume?
Only marginally. Baseline projections suggest the rule will add roughly 0.05% to national truckload volume and about 0.3% in core automotive markets (such as Detroit, Toledo, and Indianapolis), phased gradually between 2027 and 2029.
Why are truckload tender rejections surging if freight volume is flat?
The rise in the national Tender Rejection Index (STRI) is a symptom of contracting industry capacity, not increased shipping demand. Implied accepted freight volumes have actually dropped slightly year-over-year as smaller carriers exit the market.
Are CAFE standards still legally enforceable?
While the numerical targets remain on the books, their financial penalties were effectively neutralized when the One Big Beautiful Bill Act set civil non-compliance penalties to $0 in July 2025.
Which freight markets are most sensitive to automotive shifts?
Inbound parts suppliers across Michigan, Ohio, Indiana, Kentucky, Tennessee, and South Carolina, alongside dedicated automotive haulers, represent the primary corridors where localized manufacturing shifts will register first in logistics datasets.