





LONDON — On paper, England’s regional bus networks outside London are operating with unprecedented efficiency. According to recent Department for Transport (DfT) statistics, passenger journeys per service mile have climbed roughly 8.5% compared to pre-pandemic baselines, suggesting a lean, highly responsive transit system.
Yet, beneath this statistical gloss lies a more complicated and potentially precarious reality. While operators have successfully optimized schedules and slashed underperforming routes to boost profitability and operational ratios, transit analysts warn that these metrics mistake corporate cost-cutting for network improvement. As transit agencies rush to electrify their fleets, the vital question facing policymakers is whether a more "productive" bus network is actually leaving everyday riders behind.
Main Facts: The Numbers Behind the Post-Pandemic Recovery
The post-pandemic trajectory of England’s local bus networks outside London is defined by a distinct recovery gap: service mileage has lagged significantly behind the return of passenger journeys.
- Passenger Recovery: In the 2024/25 period, England (outside London) recorded approximately 1.85 billion local-bus passenger journeys, climbing back to 93.3% of its pre-COVID baseline of roughly 1.98 billion (2019/20 levels).
- Service Mileage Lag: Over the same timeframe, overall bus service mileage—the physical distance covered by local routes—has only recovered to 86.0% of its pre-pandemic baseline.
- The Productivity Equation: When these two metrics are synthesized, passenger journeys per service mile are 8.5% higher than they were before the pandemic.
At first glance, this efficiency ratio is a testament to the tactical flexibility of bus operators. Following years of post-lockdown ridership volatility, inflation, and shifting commuting patterns, operators systematically trimmed duplicate services, adjusted timetables to match peak demands, and concentrated resources on high-volume corridors.
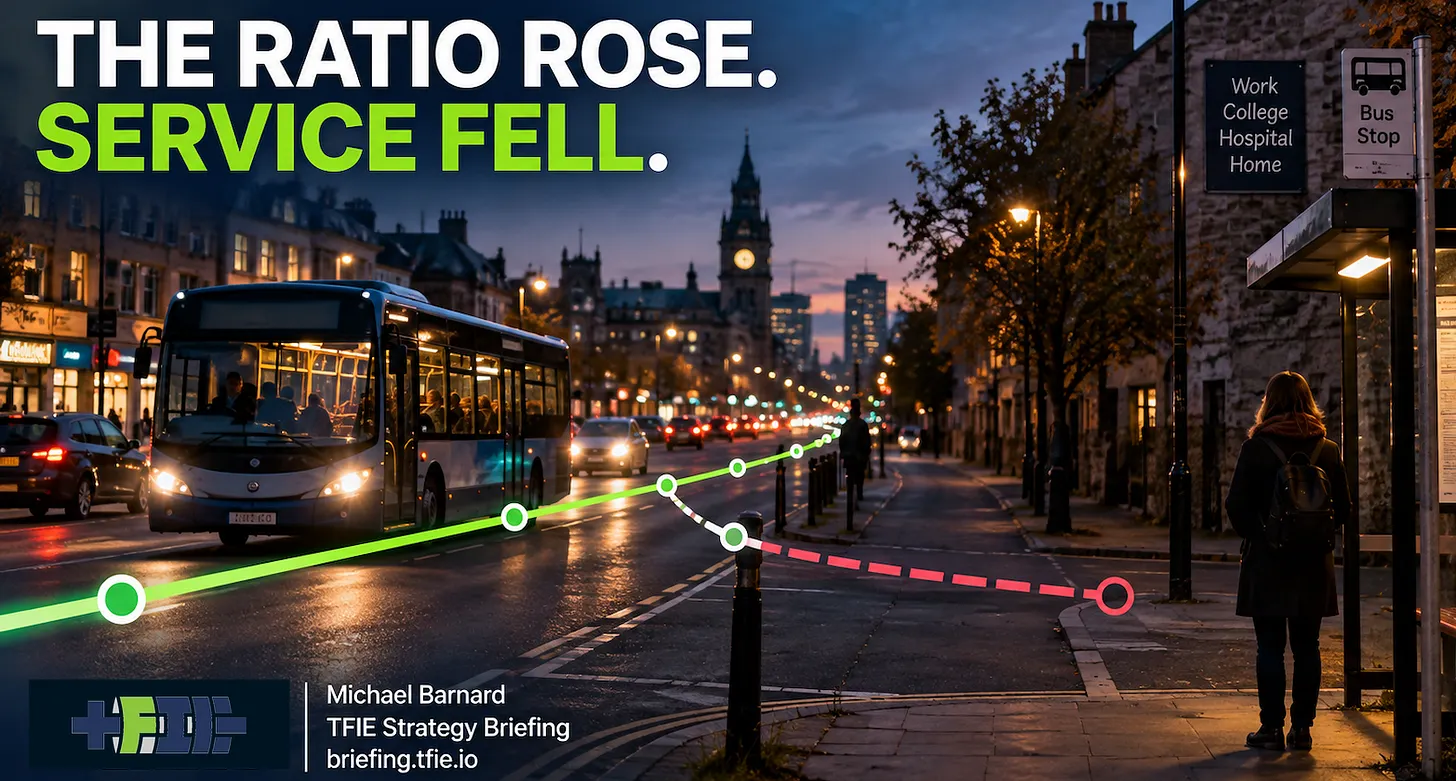
However, transport economists emphasize that counting boardings per mile measures operational output, not public utility. A high productivity ratio can simply mean that fewer buses are running, forcing remaining passengers onto more crowded vehicles, while entire communities lose their lifelines altogether.
Chronology: From Deregulation to the Post-Pandemic Reset
To understand how England’s bus networks arrived at this juncture, it is necessary to examine the historical and policy shifts that have shaped public transport governance over the last four decades.
1. The Deregulation Era (1985–2000s)
The Transport Act 1985 deregulated local bus services across Great Britain (outside London). This introduced commercial competition, transferring the initiative for route planning and fare setting from municipal authorities to private operators. While deregulation spurred cost consciousness and private investment, it gradually fragmented the network, making coordinated, region-wide planning exceedingly difficult.
2. The COVID-19 Shock and Emergency Subsidies (2020–2022)
When the COVID-19 pandemic struck in early 2020, passenger numbers plummeted overnight. To prevent catastrophic collapse, the UK government stepped in with billions of pounds in emergency recovery grants. These subsidies kept wheels turning through multiple lockdowns but accustomed the sector to a temporary operating model. As emergency funding wound down, operators were forced to realign services with permanently altered post-pandemic travel habits—such as hybrid work models and reduced off-peak leisure travel—leading to widespread network contractions.
3. The Legislative Shift and the Bus Services Act 2025
Recognizing the limits of pure market-driven route planning, the legislative landscape has begun to pivot. The introduction of the Bus Services Act 2025 marks a regulatory turning point. It requires local transport authorities utilizing enhanced partnerships to formally identify "socially necessary services"—routes whose withdrawal would materially harm access to employment, healthcare, and education, regardless of their immediate commercial profitability.
Supporting Data: Dissecting the Metrics of Mobility
The core tension in modern transit analytics centers on what data is collected and, crucially, what it fails to reveal.
The Flaw in "Boardings per Mile"
The Department for Transport measures passenger journeys as boardings. Under this definition, if a commuter takes two different buses to reach their workplace, they are counted twice.
When service mileage is reduced, the denominator in the productivity equation shrinks. If 1,000 people manage to board buses over a shortened aggregate distance of 100 miles, the ratio appears stellar (10 boardings/mile). But this metric is blind to qualitative realities:
- Trip Completion: Does the passenger still reach their final destination, or did the elimination of a connecting feeder route make the journey impossible?
- Temporal Coverage: Are evening and weekend services still functional, or is the network only viable during standard morning and evening peaks?
- Geographic Reach: Have peripheral neighborhoods and rural outposts been entirely cut off to preserve trunk-route margins?
A Tale of Three Cities: London, Dublin, and England’s Regions
A comparative look at post-pandemic strategies in London, Dublin, and regional England illustrates how different governance frameworks yield vastly different network outcomes:

- London: Maintained bus mileage at broadly stable levels, even while passenger journeys lagged behind 2019/20 benchmarks. Transport for London (TfL) leveraged its public control over network specification to absorb short-term demand shocks without sacrificing geographical coverage.
- Dublin: Substantially expanded scheduled service through the ambitious BusConnects program, subsequently driving passenger volumes above pre-pandemic 2019 levels.
- Regional England: Relied primarily on commercial retrenchment, cutting mileage to preserve margins, resulting in higher nominal "productivity" at the cost of network breadth.
Official Responses and Stakeholder Perspectives
As local authorities grapple with shrinking transport budgets and mounting carbon reduction targets, reactions to the latest DfT figures are sharply divided between commercial operators and public planners.
The Commercial Operator Perspective:
Industry representatives defend the rationalization of routes as a pragmatic and necessary economic response. With driver shortages, escalating wage bills, and rising maintenance costs, running empty or severely under-utilized buses is financially unsustainable. From this viewpoint, achieving an 8.5% increase in journeys per service mile demonstrates that capital is being deployed where the demand is strongest, ensuring the long-term survival of private operators without requiring bottomless public subsidies.
The Transport Planner and Municipal Perspective:
Conversely, urban planners and local authorities argue that treating commercial viability as the sole metric of success fundamentally misunderstands the wider economic role of public transit.
Transport analyst insights from comprehensive sectoral reports—such as The Bus Is Not the System—highlight that a bus network generates value far beyond the farebox revenue of an individual route. A modest cross-town service or an unprofitable evening feeder line can enable a shift away from second household cars, grant shift-workers access to employment, and connect isolated housing estates to regional medical centers. When these services are cut, the societal costs manifest elsewhere in the form of increased traffic congestion, social isolation, and reduced labor-market participation.
Implications: The High Stakes of Fleet Electrification
The debate over service mileage and productivity is no longer just an academic exercise in transit statistics; it has been supercharged by the national transition toward zero-emission public transport.
The Lock-In Effect of Infrastructure
Battery-electric buses (BEBs) are rapidly becoming the global baseline for urban and regional transit. However, deploying electric fleets requires massive, long-lived capital investments. Transport authorities and operators are locked into multi-decade decisions regarding:
- Heavy-duty depot upgrades and high-capacity grid connections.
- Specialized maintenance facilities and charging infrastructure.
- Long-term vehicle procurement and financing contracts.
If these multi-million-pound investments are anchored to a fragmented, commercially shrunk passenger network, cities risk ossifying today’s temporary, cost-cut boundaries for decades to come.
The Imperative for Integrated Planning
As the findings of recent transit studies suggest, market competition is exceptionally effective at driving operational efficiencies, vehicle utilization, and cost control. However, network design cannot be left entirely to the invisible hand of the market.
A modern, future-proof transport strategy requires a hybrid institutional framework: one that harnesses the commercial discipline of operators while empowering regional transport authorities to plan across operator boundaries, depots, and municipal lines.
Moving Beyond the 8.5% Metric
Ultimately, the reported 8.5% improvement in journeys per service mile serves as a valuable indicator of how well the surviving portions of England’s bus network are utilized. Yet, true progress cannot be measured by efficiency alone.
If transport planners are to build resilient, equitable, and sustainable cities, they must integrate traditional operational metrics—such as cost per vehicle-kilometer and reliability—with rigorous accessibility metrics. Authorities must actively track whether neighborhoods can access major hospitals, colleges, and employment hubs within reasonable travel times, regardless of whether a single route ledger balances at the end of the day.
Without this holistic approach, England risks engineering the most "productive" bus network possible—one that successfully runs fewer buses, carries fewer people to fewer places, and leaves the broader public stranded in its wake.