




By Freight Market Analysis Desk
Published October 2026
Main Facts
While national tender rejection rates have seemingly stabilized, hovering at an average of roughly 13.8% over the past fortnight, this headline figure masks a deeply fractured U.S. freight ecosystem. Rather than a uniform national trend, the logistics and transportation sector is witnessing a stark two-speed market.
Regional dynamics have taken center stage, driven by an unprecedented, sudden surge in the Pacific Northwest and prolonged, persistent tightness across the industrial Midwest.
The disparities are striking:
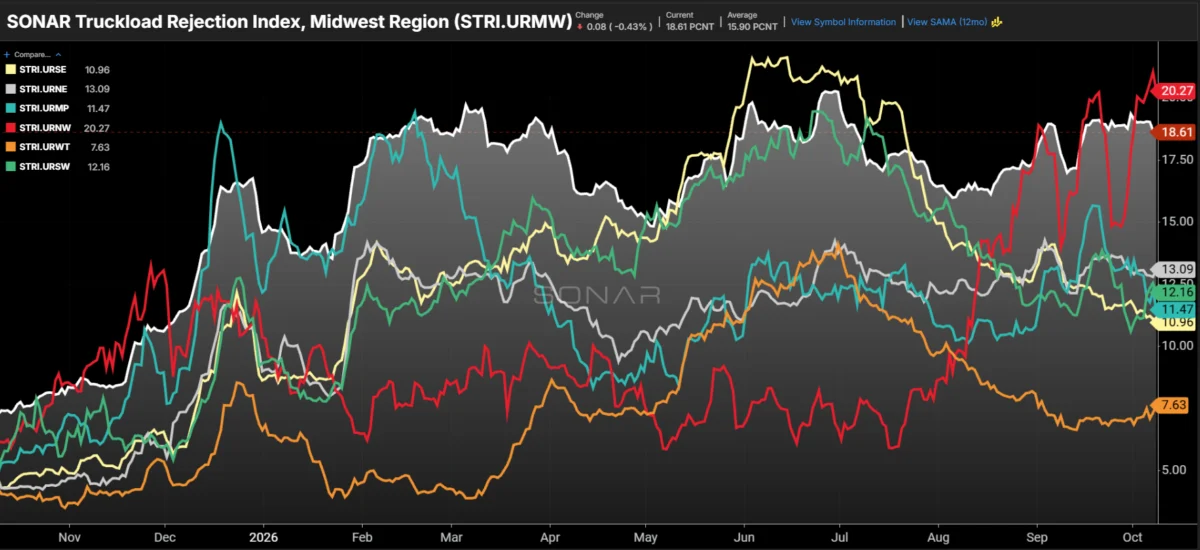
- The Northwest Region: Reached a rejection rate of 20.27% on October 8—more than triple its 6.2% reading from the same period last year—making it the tightest freight market in the country.
- The Midwest Region: Closely follows at 18.61%, maintaining a posture of sustained constraint that has defined its logistics landscape for the majority of 2026.
- The Rest of the Country: All other major U.S. regions are holding within a band of 7.6% to 13.1%, largely remaining flat or drifting slightly lower.
This stark regional bifurcation is being propelled by fundamentally different economic and operational mechanics. In the Northwest, a rapid, seasonal, reefer-driven (refrigerated) harvest rush has overwhelmed a chronically thin local fleet. In the Midwest, high rejection rates are structural, spanning multiple equipment types and reflecting robust, ongoing freight demand that consistently outstrips available capacity.
Chronology
To understand how the current freight landscape materialized, it is necessary to trace the trajectory of regional tender rejections through the course of 2026:
- January – July 2026 (The Quiet Northwest): For the first seven months of the year, the Pacific Northwest was characterized as one of the loosest freight markets in the United States. Outbound tender rejections hovered consistently between 6% and 9%. Carriers routinely avoided positioning trucks heavily in the region due to a lack of outbound headhaul opportunities, creating a fragile balance between supply and demand.
- February 2026 (The Midwest Tightens): While the rest of the country experienced varying degrees of post-peak seasonal softening, the Midwest began an upward trajectory in tender rejections, climbing past the 15% threshold and remaining there indefinitely.
- August 2026 (The Pacific Northwest Inflection Point): The baseline dynamics in Washington, Oregon, and Idaho inverted almost overnight. Driven by the early stages of agricultural harvesting, regional rejections nearly doubled over the course of a single month, setting off a cascading series of weekly increases that would eventually breach the 20% mark by early October.
- Summer to Fall 2026 (Intermodal Shifts in the South): As shippers in the Southeast and Southwest grappled with localized capacity crunches over the summer, logistics managers aggressively pivoted toward intermodal alternatives. By October, domestic intermodal volumes through major southern freight hubs like Atlanta and Dallas surged by 15% to 20% year-over-year.
- Early October 2026 (Current Market Divergence): National rejections settle near 13.8%, but the underlying data reveals a tale of two extremes: a 41% reefer rejection rate in the Northwest alongside steady, 15% to 18% structural rejections across the industrial heartland of the Midwest.
Supporting Data
A granular analysis of SONAR regional tender data (STRI.URMW, STRI.URNW, STRI.URSE, STRI.URSW, STRI.URNE) illuminates the mechanics behind the divergence. The split is most visibly pronounced when examining equipment type and volume metrics.
The Northwest Reefer Surge
The Pacific Northwest’s spike is almost exclusively a function of refrigerated transport demand.
- October Reefer Rejections: Averaged 41% during the first week of October, a dramatic leap from approximately 17% in July and roughly 16% in October of the previous year.
- Van Rejections: By contrast, standard dry van rejections in the region remain exceptionally tame, sitting below 5%.
- Volume Discrepancies: Reefer tender volumes in the Northwest have surged by 65% since July and are up 35% year-over-year. Meanwhile, dry van volumes in the region have contracted, sitting 11% lower than levels recorded at this time last year.
Interestingly, this surge is not the result of a bumper crop. According to USDA estimates cited by The Packer, Washington’s 2026 apple harvest is projected at 176.2 million bushels—a 2% decrease from the previous year—while the broader national apple crop is down 7%. Therefore, the intense capacity crunch is less about record-shattering raw volume and more about the acute velocity and concentration of the harvest hitting a diminished local fleet.

The Midwest’s Broad-Based Tightness
While the Northwest’s spike is seasonal and localized, the Midwest presents a systemic challenge.
- Rejection Persistence: The region’s rejection rate has hovered at or above 15% since February 2026, sitting at 18.61% in October compared to just 7.6% in October 2025.
- Volume Growth: Tender volume in the Midwest is up roughly 10% year-over-year, comfortably outpacing the national average gain of 8%.
- Equipment Versatility: Unlike the Northwest, capacity constraints in the Midwest are not limited to reefers. Dry van rejections are hovering near 15%—roughly two and a half times last year’s rate—while reefer rejections are approaching 29%, up from 15% twelve months prior.
Official Responses and Industry Insights
Market experts and data scientists monitoring the FreightWaves SONAR platform emphasize that understanding these regional variances is critical for shipper contract compliance and carrier network planning.
"The Northwest spike is largely a product of regional demand volatility combined with national capacity being meaningfully lower compared to last year," industry analysts noted. Because the region traditionally generates limited outbound freight during non-harvest months, carriers systematically structure their networks to avoid getting trapped with equipment in a difficult exit market. When the agricultural window opens, the existing footprint of trucks is simply insufficient to absorb the sudden influx of shipments.
Conversely, the Midwest tells a different macroeconomic story. As the largest freight-producing region in the United States, running five points above the national rejection rate while volumes continue to expand serves as a bellwether for the broader industrial economy.
"That makes it more of a long-term signal: the region has plenty of freight, and carriers have struggled with tender compliance there for nearly a year," market commentators observed. Even as other pockets of the national transportation market experience relative ease, the Midwest refuses to soften, showing minimal deviation from its spring and summer highs.
To mitigate these pressures, supply chain executives in constrained regions have increasingly leaned on multimodal strategies. Shippers in southern corridors have heavily utilized rail-truck intermodal options, insulating themselves from localized truckload capacity squeezes.
Implications
The current state of the U.S. freight market carries profound implications for shippers, carriers, and 3PLs as the industry heads toward the winter operating environment:
- For Shippers in the Pacific Northwest: The acute reefer shortage underscores the danger of relying solely on spot-market capacity during peak agricultural windows. Shippers must cultivate deeper, strategic relationships with carriers well in advance of the harvest season, offering balanced network pairings or premium pricing to secure dedicated equipment. However, relief is on the horizon; as winter sets in and the harvest concludes, regional rejections are expected to recede rapidly.
- For Shippers in the Midwest: The persistent 15%+ rejection rate indicates that capacity is structurally tight across the industrial heartland. Shippers cannot treat this as a temporary disruption. Operating in this environment requires optimized routing guides, higher contractual compliance enforcement, and potentially absorbing higher baseline transportation costs to maintain supply chain continuity.
- For Motor Carriers: Fleet operators face strategic decisions regarding network balance. While chasing the high spot-market rates associated with the Northwest harvest can yield short-term windfalls, carriers must carefully manage deadhead miles when exiting the region. In the Midwest, sustained high demand offers carriers substantial leverage in contract negotiations, though rising operational costs require disciplined margin management.
- Broader Macroeconomic Outlook: The bifurcation of the freight market illustrates the limitations of relying purely on national averages. Logistics professionals utilizing real-time freight market data platforms like SONAR are better equipped to navigate localized volatility, optimize intermodal routing, and anticipate regional imbalances before they impact corporate bottom lines.
Data and charts referenced in this report are powered by FreightWaves SONAR. Industry professionals interested in real-time freight market intelligence can request a SONAR demonstration through the official FreightWaves platform.