





Executive Summary: The Rising Cost of Global Trade
The Euro area’s economic landscape faced renewed inflationary pressure in August 2026, as import prices for total industry experienced a marked increase. According to the latest data release from Eurostat (dataset TEIIS011), the index of import prices for the 20-country bloc reached 119.2 points, based on a 2021 benchmark of 100. This upward trajectory, characterized by a 1.0 percent month-on-month rise and a significant 8.2 percent year-on-year climb, underscores the ongoing volatility in global supply chains and the rising costs of raw materials and finished goods entering the European market.
The data, finalized and published on October 24, 2026, offers a sobering look at the external factors influencing the Eurozone’s domestic price stability. As central banks and policymakers monitor these figures, the sustained growth in import costs raises critical questions about the persistence of "imported inflation" and its potential to dampen the region’s broader economic recovery efforts.
Chronology of Economic Indicators: August 2026
To understand the significance of the August figures, one must examine the progression of the index throughout the year. The August update confirms that the trend observed in late summer is not an isolated incident but part of a broader, more persistent inflationary cycle.
The July-to-August Transition
Between July and August 2026, the import price index shifted from its previous standing to a 1.0 percent increase. While a single month’s change may seem marginal in isolation, in the context of industrial production and manufacturing, this jump represents a significant escalation in the cost of intermediate goods. Manufacturers across the Eurozone, particularly in energy-intensive sectors, are being forced to absorb these costs or pass them on to consumers, further complicating the European Central Bank’s (ECB) mandate to maintain price stability.
The Year-on-Year Narrative
The most telling metric remains the 8.2 percent year-on-year increase. Comparing August 2026 to August 2025, it is clear that the cost of doing business internationally has become substantially more expensive. This differential suggests that the structural drivers of inflation—including geopolitical instability, logistics bottlenecks, and energy market fluctuations—remained firmly embedded in the Euro area’s trade dynamics throughout the middle of the year.
Supporting Data: Deconstructing the Index
The Eurostat dataset TEIIS011 provides a granular view of the "Total Industry" import sector. By utilizing a 2021 base year, analysts can track how prices have diverged since the post-pandemic recovery phase.
Understanding the 119.2 Index Value
The index value of 119.2 indicates that import prices have risen by 19.2 percent cumulatively since the 2021 reference period. This figure acts as a barometer for the cost of imports, covering everything from crude oil and natural gas to essential raw materials and finished industrial components.
Non-Seasonally Adjusted Realities
It is important to note that the figures are not seasonally adjusted. In economic reporting, this provides a "raw" look at the market. While seasonal adjustment is often used to smooth out predictable fluctuations (such as summer manufacturing slowdowns), the non-seasonally adjusted data reported by Eurostat reflects the literal cost burden faced by importers during the month of August. This transparency is vital for industrial procurement managers who must budget based on actual market fluctuations rather than smoothed trends.
Global Context: The Transatlantic Divergence
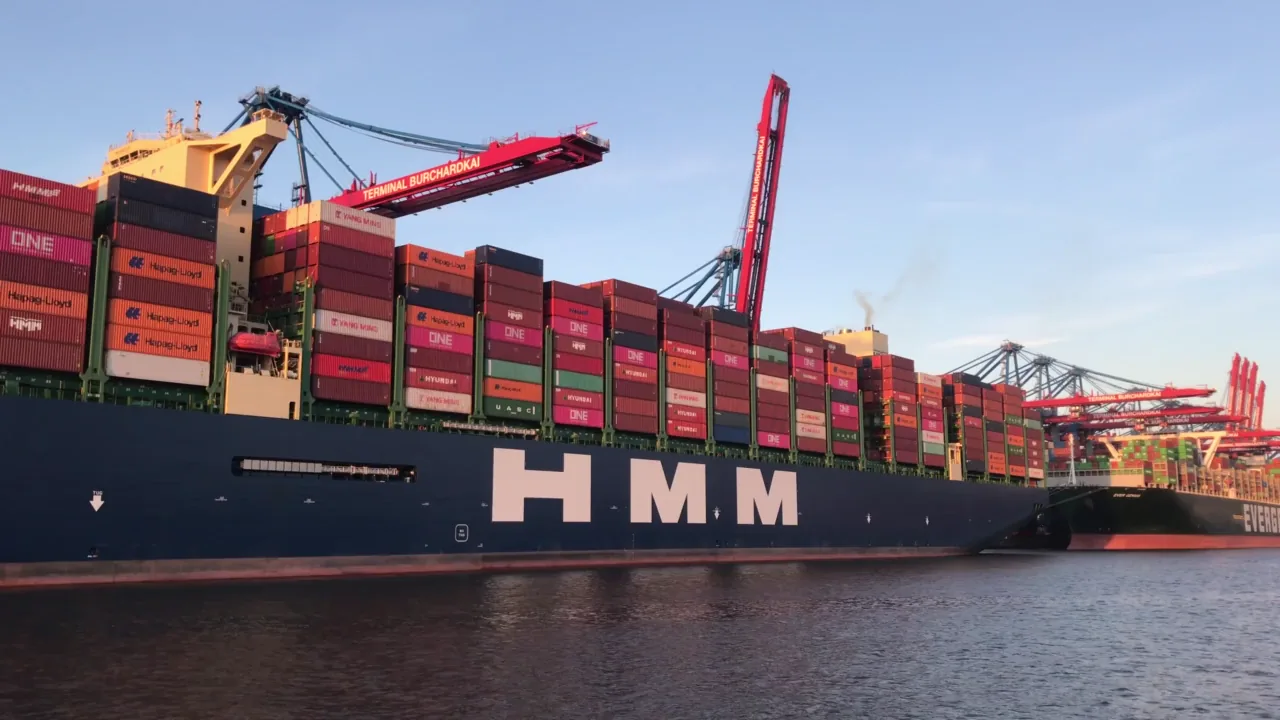
The Euro area’s experience is not happening in a vacuum. As noted in recent trade intelligence, the U.S. has simultaneously seen record-breaking container volumes, particularly in September 2026. This indicates that while the Euro area is dealing with higher prices for imports, the global economy is simultaneously dealing with high volumes of movement. The convergence of high volumes and high prices suggests a global supply chain that is straining under the weight of sustained demand, even as costs continue to rise.
Official Responses and Expert Analysis
While the European Commission and Eurostat provide the objective data, the interpretation of these figures rests with policy analysts, trade economists, and central bankers.
Eurostat’s Role in Transparency
Eurostat’s update on October 24, 2026, serves as the definitive record for industrial import pricing. By maintaining the TEIIS011 dataset, the statistical office ensures that policy decisions are grounded in empirical evidence. The release serves as a critical update for the European Central Bank’s governing council, providing the data necessary to calibrate interest rate policies and liquidity measures.
Market Intelligence Perspectives
Analysts at platforms such as IndexBox have noted that the 8.2 percent year-on-year increase serves as a warning sign for industrial competitiveness. If the Eurozone cannot manage its import costs, the resulting "cost-push" inflation will inevitably erode the competitive edge of European exports. Businesses are currently caught in a squeeze: they must import at higher costs, yet they face stiff competition from global markets where cost structures may vary significantly.
Implications for the Euro Area Economy
The ramifications of a sustained 8.2 percent increase in import prices are far-reaching, touching upon fiscal policy, consumer behavior, and long-term industrial strategy.
1. The Threat of Cost-Push Inflation
The primary concern for policymakers is that these rising import costs will translate directly into consumer price inflation (CPI). When the price of raw materials—such as steel, aluminum, or chemical feedstocks—rises, manufacturers pass these costs down the supply chain. If this trend continues, the Euro area could face a "second-round effect" where wage demands rise to compensate for the higher cost of living, leading to a wage-price spiral that is notoriously difficult to break.
2. Impact on Industrial Competitiveness
European manufacturing, which has historically relied on the efficiency of global supply chains, is particularly vulnerable to these price spikes. Countries with high energy dependency are seeing the most dramatic shifts. To remain competitive, many European firms are being pushed to innovate, seek local substitutes for imports, or invest in greater energy efficiency. However, these are long-term solutions, and the current import price data highlights a short-term crisis of affordability for industrial inputs.
3. Monetary Policy Tightening
The European Central Bank is tasked with maintaining price stability, defined as a medium-term inflation target of 2 percent. An 8.2 percent rise in import prices, if sustained, makes the ECB’s task significantly harder. While the ECB cannot directly control global import prices, it can influence domestic demand through interest rate adjustments. If the import price index continues to rise, the likelihood of a hawkish monetary policy stance increases, which in turn could dampen investment and slow down regional GDP growth.
4. Supply Chain Diversification
The August 2026 data serves as a catalyst for a broader discussion on "near-shoring" and "friend-shoring." By analyzing which imports are driving the price index, European firms are increasingly looking for ways to reduce reliance on volatile markets. The goal is to create a more resilient supply chain that is less susceptible to the sudden shocks reflected in the August Eurostat report.
Looking Ahead: Preparing for the Final Quarter of 2026
As the Euro area moves past the August reporting period and into the final quarter of 2026, the focus will shift to whether these price increases are peaking or represent a new "new normal."
Monitoring Global Trends
The correlation between U.S. container volumes and Euro area import prices suggests that the global trade environment is in a state of high-intensity flux. Analysts will be closely watching the Q4 data to see if the 1.0 percent monthly increase in August was a temporary spike or the beginning of a sustained trend into the winter months, where energy imports typically rise.
Strategic Recommendations for Stakeholders
- For Manufacturers: Focus on hedging strategies for raw material procurement to mitigate the impact of price volatility.
- For Policymakers: Prioritize investments in energy infrastructure and supply chain diversification to reduce the Eurozone’s vulnerability to external price shocks.
- For Investors: Monitor the relationship between import price indices and corporate profit margins, as the ability to pass on costs will be a key differentiator in stock performance for the remainder of the year.
Conclusion: A Critical Juncture
The August 2026 Eurostat report is more than a collection of numbers; it is a reflection of the challenges inherent in a globalized economy. With an 8.2 percent year-on-year rise in import prices, the Euro area is navigating a complex landscape of persistent inflation and supply chain strain.
The data provided by Eurostat highlights that while the economy has shown resilience, the upward pressure on industrial costs cannot be ignored. As stakeholders—from the factory floor to the central bank boardrooms—digest these figures, the consensus remains that structural reform, innovation, and strategic procurement will be the cornerstones of navigating this challenging economic cycle. The coming months will be decisive in determining whether the Eurozone can successfully stabilize its import costs or if it must prepare for a more prolonged period of inflationary pressure.
Data Source: Eurostat dataset TEIIS011, updated October 24, 2026. Analysis provided in collaboration with IndexBox Market Intelligence.